Saturday, May 11, 2013

Graphing with LiveCode, Part 2: Graphing Functions

I did a search for other ways to do graphing with LiveCode. I quickly found a tutorial on the RunRev site: http://lessons.runrev.com/s/lessons/m/4071/l/7049-how-to-make-a-simple-line-graph

This is worth a look as it provides a clever way to create static line graphs based on a list of numbers in a field. However, it doesn't seem to create a running, dynamic line graph of the kind I am trying to show in this series of blog postings.

Also, there is also a commercial product called ChartMaker for LiveCode:
http://www.flexiblelearning.com/chartmaker/

This is a LiveCode extension, meaning that you can extend the functionality of LiveCode to include making charts. It isn't too expensive (about $76), but then again, it isn't free. I don't know anything about it other than what I've read on the company's Web site. But, my cursory review of the product doesn't lead me to believe it can create dynmanic graphs "on the fly" either.

So, I think we still need to learn how to do this on our own with scripting in LiveCode.

In my last post, we learned how to "connect the dots" by using the brush tool (a bitmap graphic tool), choosing a brush color and shape, then dragging the brush from point to point using x,y coordinates where x and y are 0 at the top left corner of the LiveCode window. Now we need to learn how to use these skills to graph functions where y depends on x. I think the simplest example is y=x, meaning that whatever x is, y will be the exactly the same. So, the pairs of coordinates would be the following:

0,0
1,1
2,2
3,3
4,4
And so on...

So, how do we program LiveCode to graph y=x? It's easy. Here's the script for a button "Graph Function":

on mouseUp
   choose brush tool
   set the brush to 32
   set the brushColor to orange -- could use an RGB triplet here
   set the dragSpeed to 0
   //Set the starting point for the x and y variables:
   put 0 into var_x
   put 0 into var_y
   put 0 into var_xprev
   put 0 into var_yprev
  
   repeat 250 times
      //add one to var_x:
      put var_x+1 into var_x
      //This is the function "y=x" scripted in LiveCode:
      put 3*var_x+50 into var_y     
      drag from var_xprev, var_yprev to var_x, var_y
      put var_x into var_xprev
      put var_y into var_yprev
   end repeat
   choose browse tool
end mouseUp

And here is the resulting "graph," a line that is draw starting from the top-left corner of the window down to the center of the window (I set the window size of the stack to 500 x 500):


Let's now analyze and explain this script. First, many of you who received an "A" in algebra many years ago are probably saying "But shouldn't the graph be drawn going up and towards the right?" Yes, that is why you got an "A"! We will deal with this little problem before this post ends. Just try to ignore this problem for now.

Lines 7 and 8 set the two x and y variables both to 0. (I've kept with good scripting conventions and labeled them var_x and var_y to make it clear in the script that they are variables.) These lines set the starting point for the graph.

As we consider lines 9 and 10, you need to remember how the drag function works in LiveCode. You have to drag between two points. And, remember from my previous post that to draw a graph, we had to make sure that the ending point of one line segment became the starting point for the next line segment (i.e. connecting the dots). So, lines 9 and 10 set up two other variables that will be used to keep track of the coordinates of the end point of the previous line segment. Jump down to lines 18 and 19. These two lines pass the contents of var_x and var_y to these two variables I've cleverly named var_xprev and var_yprev (where 'prev' is short for previous). So, lines 9 and 10 just set these two variables also to 0 so that we have two pairs of numbers for the very first line segment. But, let's not get ahead of ourselves.

Lines 12 to 20 comprise a repeating loop that repeats 250 times. (In later posts, we'll get more sophisticated in how long or how far to graph. However, another good option -- if you want to be daring -- is to change line 12 to "repeat until the mouseClick" which will repeat forever until the mouse is clicked.)

Line 14 adds one to var_x, or 1+0, making it equal to 1. This is the classic way of incrementing a variable in a repeating loop.

Line 16, believe it or not, is the way we script the function "y=x" in LiveCode:

put var_x into var_y

In other words, putting x into y is the same as saying make y equal to x. So, var_y and var_x are both now 1.

Line 17 drags the brush between the two points. So, this script actually draws 250 individual line segments. (If you wanted to speed things up, you could change line 14 to "put var_x+2 into var_x" and repeat the loop only 125 times.)

As already mentioned, lines 18 and 19 pass the contents of var_x and var_y to var_xprev and var_yprev.

In algebra textbooks, you will see this function written in what is called the slope-intercept form:

y=mx+b

where m is the slope of the line and b is the place where the line intersects the y axis (known as the y-intercept). So, I know you are saying, "Cool! Let's do some stuff by including m and b in our equation!" (Man, you are geeky.)

OK, let's change line 16 to the following:

put 3*var_x+50 into var_y

Let's also change the brush color to orange in line 4, so the new line is easier to distinguish from the first line. Here is what we get when we run the script by clicking on the button:


As you can tell, the line is much steeper. That's because the slope is now 3. Also notice how the line starts down 50 pixels. Also notice that something a little weird happens right at the start. That weirdness is caused by the fact that var_x and var_y are still starting at 0 because of lines 7 and 8. Actually, when x is 0, y should 50 because 3x will equal 0. So, this is another little problem we need to solve. We can easily solve it by first setting var_xprev and var_yprev to some number far off to the top left, such as -1000, -1000. Do that and the graph now looks fine:


The computer has drawn an orange line from -1000,-1000 to 0,50, but we just can't see it because it is off to the left of the current window.

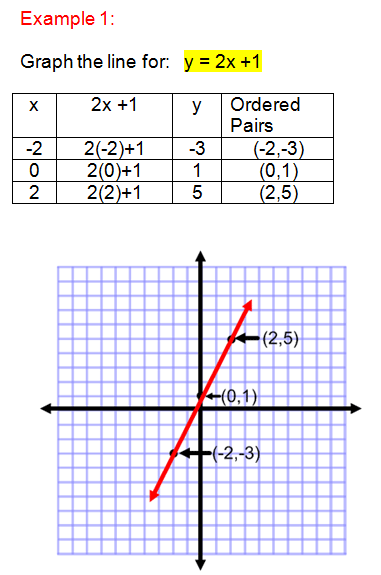
Let's draw one more line, using the function "y=2x+1". We need to update line 16 to the following:

      put 2*var_x+1 into var_y

I'll change the brush color to red. Here is the resulting graph:


I used this example because so we could compare it to what we would see in an algebra textbook. Here is a nice figure of the graph of y=2x+1 from http://www.algebra-class.com/table-of-values.html:


Two things jump out at me. First, their red line slants upward from left to right, not downward. Second, the 0,0 origin is at the center of the graph (not the top-left point). The first is a problem that results from the fact that in LiveCode the y axis simply goes in the other direction of the traditional Cartesian coordinate system. That problem will be easily solved just by multiplying all y values by -1. This will essentially "flip" the y axis.

To deal with the second issue, we need to choose 250,250 (the center of the window) as our starting point, instead of 0,0. So, we need to offset both x and y by 250 pixels.

OK, let's see how to do this. Let's start by graphing our original function of y=x. So, to flip the y axis, here is the script for line 16:

      put -(var_x) into var_y

This just means to put the negative of whatever var_x is into var_y.

Lines 17-19 have to be modified to add 250 to var_x and var_y, because of the offset:

      drag from var_xprev, var_yprev to var_x+250, var_y+250
      put var_x+250 into var_xprev
      put var_y+250 into var_yprev

Make these two changes and here is the resulting graph (I also changed the brush color back to brown):


Let's now enter our second function from above, making sure again to multiple var_x by -1. This changes line 16 to:

      put -(3*var_x+50) into var_y

Here's the resulting graph (I changed the brush color to orange to show the second line):


Perfect!

Let's end this rather long blog posting by using LiveCode's vector tools to draw the x and y axes, making sure that they cross exactly at point 250,250 (also be sure to draw these axis lines with arrows at both ends, otherwise your algebra teacher will find and reprimand you; the option to add arrow heads can be found in the "basic properties" window of each line). Here is a resulting graph that any algebra teacher would be proud of:


Note, something very important and wonderful. You can now change the origin of the graph just by manipulating these two numbers (currently 250). So, if you wanted the graph's origin to be over 100 and down 300, you would change these numbers accordingly.

In the next posting, we'll continue this graphing exploration by graphing the function for a parabola and the sine and cosine functions. I also promise in my next post to provide a LiveCode stack you can download with all of the scripts we've covered.


Sunday, May 5, 2013

Graphing with LiveCode, Part 1: Colorful Addendum

It really bothered me how boring my last post was. So, here is a little example of what one could do with the skills described in my last post, coupled with a little knowledge of variables and random numbers.

Here is the script from a button titled appropriately enough "Draw Colorful Lines at Random":

global varX, varY, varXprev, varYprev, varRGB1, varRGB2, varRGB3

on mouseUp
   choose brush tool
   set the brush to 32
   set the dragSpeed to 0
   put 250 into varXprev
   put 250 into varYprev
  
   repeat until the mouseclick
      hide button "Draw Random Colorful Lines"
      hide button "Erase"
      put round(random(500)) into varX
      put round(random(500)) into varY
      put round(random(255)) into varRGB1
      put round(random(255)) into varRGB2
      put round(random(255)) into varRGB3
      set the brushColor to varRGB1, varRGB2, varRGB3
      drag from varXprev, varYprev to varX, varY
      put varX into varXprev
      put varY into varYprev
   end repeat
   choose browse tool
   show button "Erase"
end mouseUp

I hope you can quickly see that it is nothing more than a quickly revised script of the button "Draw Lines" from my previous post.

Here is a screenshot of the program after running for 60 seconds:

And, this static image, "avant-garde" as it is, is nothing compared to being mesmerized by watching the program run.

There, I feel better.

Saturday, May 4, 2013

Graphing with LiveCode, Part 1: Learning How to Draw Lines with Scripts

In my previous post, I casually mentioned that it would be cool to graph the changing rate at which unique random codes were being generated. Graphing is a powerful visual tool. But how would one actually do this in LiveCode?

First, unfortunately, there is no graphing tool or widget in LiveCode (at least not that I'm aware of). But, LiveCode has many graphical drawing tools. In fact, it has the two most common graphical types: bitmap (i.e. paint) and vector (i.e. drawing).  I'm assuming you know the difference between the two. If not, you might want to do a quick google search at this point to learn the difference. In short, bitmap graphics are merely the turning on or off of pixels on the screen, whereas vector-based graphics are "defined" as objects. For example, if you've ever used a graphics package where you create rectangles and ovals and then could stretch any of these by clicking and holding on one of the the object's handles, or if you could click on the object and continually choose different line widths, line colors, fill colors, etc. after first drawing the object, then you are using a vector-based tool. It's as though the object is defined as having so many sides or lines, with each line being straight or curved, and being such and such color and thickness, etc. In contrast, bitmap graphics are drawn on the screen with attributes that cannot be changed or manipulated, other than by doing things such as taking an "eraser" tool and slowly erasing the object, or selecting an area of the screen and choosing to cut it.

So, it's great that LiveCode has both. In the tools palette, the bitmap graphic tools are in the bottommost section (e.g. spray can, eraser, pencil, etc.) and the vector graphics tools are just above those (e.g. rectangle tool, oval tool, line tool, etc.):


If you are still fuzzy on the whole bitmap vs. vector graphics thing, I suggest you take 5 minutes to play with these tools now. Just open a new card and start drawing a bunch of graphics. You'll quickly deduce the difference between these two graphics families.

In this blog entry, I'm just going to show how to draw a simple line with the brush bitmap tool. We won't actually do any graphing in the mathematical sense until part 2. But, you have to first understand how to use these tools first in simple scripts. So, this post will be rather boring in that we won't try to do any mathematical graphing (something I'll define better next time). Let's just take a few minutes to learn how to use scripting techniques to draw lines on the screen.

Cartesian Coordinate System - LiveCode Style


OK, let's get into it. Consider the following code of a button titled "Draw Lines":

 on mouseUp
   choose brush tool
   set the brush to 32
   set the brushColor to brown
   set the dragSpeed to 0
   drag from 25,200 to 50,150
   drag from 50,150 to 75,175
   drag from 75,175 to 100,140
   choose browse tool
end mouseUp

This script is yet another example of the natural language-feel of LiveCode. Line 2 says to choose the brush tool from the various bitmap graphic tools.

Line three selects the brush shape that will be used.  There are 35 built-in shapes. According to the LiveCode dictionary: "A brushID is a built-in brush number between 1 and 35. (These brushes correspond to LiveCode's built-in patterns 101 to 135.) By default, the brush is set to 8 (a round brush)."

32 is a thin, square brush shape, and a good one for plotting line graphs. 28 is probably the thinnest brush to choose. Brushes 5-8 give different round sizes, whereas brushes 1-4 give similar sizes, but in a square shape.

Line four chooses the color that the brush will paint with -- you can also use an RGB triplet here instead (e.g. 127,127,255).

Line five sets the speed at which the brush will draw, with 0 being as fast as possible (0 is best thought of as instantaneous).

Lines 6-8 draw three lines and we need to understand them perfectly before going on. First, you need to understand the grid system of the LiveCode stack window. Each pixel in the window can be identified with a pair of numbers. The first indicates how far from the left edge to go and the second number indicates how far from the top edge to go. So, with the pair 25, 200, you start from the top left corner and go to the right 25 pixels, then down 200 pixels.

At this point I'm hoping you are having a flashback to your high school algebra days to remember something called the Cartesian Coordinate system (named after the famous mathematician and philosopher, René Descartes). This is simply the same sort of grid consisting of two lines -- the x-axis (horizontal) and the y-axis (vertical) -- crossing each other at right angles, usually drawn to resemble a big plus sign, with the origin -- 0,0 -- at the center. (These crisscrossing lines are just that "lines," in the formal mathematical sense, meaning that they extend infinitely in all four directions, symbolized by small arrow heads.) The LiveCode grid system is similar except that 0,0 is in the top-left corner of the screen meaning that as the vertical number (second of the pair) gets bigger, the further down you go. In contrast, as y gets bigger using the classic Cartesian grid, you go up. This little difference will become more important in my next blog entry.

So, line 6 tells the computer to go to point 25, 200 (i.e. starting at the top left corner, go over 25 and down 200), then drag the brush to point 50,150, leaving a line segment between the two points.

Line 7 starts at 50,150, then drags another line to point 75,175. Finally, line 8 starts at 75, 175 and drags a final line to point 100,140. So, all we are doing is connecting the dots. Here is what the 3 line segments look like in a stack of size 500 by 500:

Not too exciting, I realize. But, you should play with this code, drawing different lines all connected to each other just by changing the coordinates (the pair of numbers for each starting or ending point) of the drag command. To have one long jagged line created, just be sure that the starting point of the next line segment is exactly the same as the ending point of the previous line segment.

Now notice line 9 -- "choose browse tool" -- this is the tool represented by the left arrow in the top left corner of the tool palette. If you leave off this command, the brush tool remains chosen and you will have to manually choose the browse tool.

OK, I Drew Some Graphics, So How Do I Erase Them?


Now, notice the Erase button. That button does just what it says -- it will erase all bitmapped graphics drawn on the card. Here's the code for this button:

on mouseUp
   choose select tool
   drag from 0,0 to 500,500
   cut
   choose browse tool
end mouseUp

The select tool is the first bitmap tool in the tool palette represented by the dotted rectangle. By dragging from 0,0 to 500,500 with the select tool, you have actually chosen the entire stack window. The command "cut" does just that -- it cuts, or removes, whatever bitmapped graphics are in this area.

OK, that's enough for now. Take some time to play with these commands, perhaps being bold and playing with other bitmapped tools using this scripting approach. If you haven't noticed already, these scripts mimic what you would do manually with your mouse, selecting various tools and drawing with them. It's pretty cool that you can actually script out these choices and movements with LiveCode.

In my next blog entry, I take these bitmap graphic scripting skills to the next level by using them to graph any mathematical equation, including lines, parabolas, the sine curve, whatever. I know, you can hardly wait.

Note: I deliberately have not provided any LiveCode file with this blog post. I'll include later one stack with all of the codes described in all the postings associated with this topic.